The Air We Breathe: Why Measuring It Is the First Step to Protecting It
Air pollution contributes to millions of deaths a year, yet most of us never see a number for it. A grounded look at the AQI, the WHO guidelines, four cities over three decades, and a new air-quality monitoring node at SETU Carlow.
Air is the one resource we consume without ever choosing to. We can decide what to eat or drink, but not whether to breathe, and we do it roughly twenty thousand times a day. That makes air quality unusual among environmental risks: it reaches everyone, everywhere, without exception. The World Health Organization estimates that outdoor and indoor air pollution together contribute to around seven million premature deaths each year, and that some 99% of the world’s population breathes air that exceeds its recommended limits for fine particles [1][3]. Air pollution now sits among the leading environmental causes of death worldwide, linked to heart disease, stroke, chronic lung disease and lung cancer [2].
And yet, for most of us, the air carries no label. We read the calorie count on a packet and the hardness of our water, but we rarely see a single number for the thing we depend on most. This piece is about that number — what it means, where it came from, what pushes it up and down, and why the first step toward cleaner air is, quite simply, to measure it. It ends closer to home, with a small monitoring node we have installed on the SETU Carlow campus, and with a research programme it has set in motion.
Air reaches everyone; a number for it reaches almost no one. Closing that gap is where cleaner air begins.
One number for a complicated thing
“Air quality” is really a shorthand for a mixture: a shifting cocktail of gases and particles, each with its own sources and its own effect on the body. To make that mixture legible to the public, regulators collapse it into a single figure — the Air Quality Index, or AQI.
The idea is younger than it looks. Before 1976, air quality reporting in the United States was a patchwork; more than fifty cities used over a dozen different indices, each with its own scale and its own warnings, which made the numbers almost impossible to compare [5][6]. Acting on a mandate from the Clean Air Act, the US Environmental Protection Agency introduced a single national index in 1976, the Pollutant Standards Index, and renamed it the Air Quality Index in 1999, adding separate treatment for fine and coarse particles [6]. The framework — a 0-to-500 scale, divided into colour-coded bands from “Good” to “Hazardous,” with the overall value set by whichever pollutant is worst at that moment — has since been adopted and adapted by governments around the world [5][6].
Two distinctions are worth keeping straight. First, the AQI is a communication tool, not a law of nature: different countries use different concentration thresholds, so the same air can score differently depending on whose index you use. Second, and more consequential, the WHO’s air quality guidelines are health-based recommendations, not legally binding limits. They describe the concentrations below which harm becomes hard to detect in the evidence; each country then sets its own enforceable standards, many of them far weaker than the guideline [4]. That gap matters, because a city can be fully “compliant” with its national law and still sit well above the level the science considers safe.
What we measure, and why the weather matters
A modern monitoring station tracks two different kinds of variable, and the difference between them is the key to everything that follows.
The first kind is the pollutants themselves — the substances that determine the index. The most closely watched are particulate matter, split by size into PM2.5 (particles 2.5 micrometres across or smaller) and PM10 (10 micrometres or smaller), together with the reactive gases ozone (O₃), nitrogen dioxide (NO₂), sulphur dioxide (SO₂) and carbon monoxide (CO) [4]. Fine particles are the ones public-health researchers worry about most: at roughly a thirtieth of the width of a human hair, they slip past the body’s natural defences, lodge deep in the lungs and pass into the bloodstream [4].
The second kind of variable is meteorological — temperature, atmospheric pressure, humidity, and wind speed and direction. These do not appear in the AQI formula, and that is the point most often missed: weather does not pollute, but it governs what the pollution does. A temperature inversion — a layer of warm air sitting over cold, common on still winter nights and in valleys — acts like a lid, trapping emissions near the ground until concentrations climb [15]. Wind does the opposite, dispersing local pollution or carrying someone else’s across a region. Humidity changes the chemistry, helping some gases convert into secondary particles and making particles swell as they take up water. It is why the same traffic on the same street can produce clean air one day and a haze the next.
That relationship is also what makes forecasting possible. Because concentrations are driven by physical processes that follow rules, a model that combines a site’s pollutant history with meteorological inputs — increasingly using machine-learning methods trained on years of such data — can anticipate tomorrow’s air rather than merely report yesterday’s. The seven-day forecast on the IQAir platform is itself generated this way [20]. Prediction, in turn, is what lets a school, a hospital or a city act before a bad day arrives instead of after.
The guideline values, and what exceeding them costs
In 2021, after weighing fifteen years of new evidence, the WHO tightened its guidelines substantially — halving the recommended annual limit for fine particles and cutting the limit for nitrogen dioxide by three-quarters — because harm was now being detected at concentrations once assumed to be safe [4]. The current guideline levels are summarised below.
| Pollutant | Short-term guideline | Long-term guideline |
|---|---|---|
| PM2.5 (fine particles) | 15 µg/m³ (24-hour) | 5 µg/m³ (annual) |
| PM10 (coarse particles) | 45 µg/m³ (24-hour) | 15 µg/m³ (annual) |
| Nitrogen dioxide (NO₂) | 25 µg/m³ (24-hour) | 10 µg/m³ (annual) |
| Ozone (O₃) | 100 µg/m³ (8-hour) | 60 µg/m³ (peak season) |
| Sulphur dioxide (SO₂) | 40 µg/m³ (24-hour) | — |
| Carbon monoxide (CO) | 4 mg/m³ (24-hour) | — |
Source: World Health Organization, 2021 [4].
Behind each of these numbers is a dose-response relationship. Sustained exposure to fine particles is associated with a meaningful share of the world’s chronic disease: the WHO attributes to air pollution roughly a quarter of adult deaths from heart disease, a quarter from stroke, more than 40% from chronic obstructive pulmonary disease and close to a third from lung cancer [1][2]. Short, intense episodes send the most vulnerable — children, older adults, and those with existing heart or lung conditions — to hospital. None of this is confined to distant mega cities; the burden falls hardest on low- and middle-income countries, but no population is exempt [1][2].
Where it comes from, and how it is reduced
Strip the sources down and one process dominates: combustion. Road transport, electricity generation, industry, the heating and cooking of homes, and the open burning of crop residue and waste all release particles and reactive gases into the air, joined by wind-blown dust and by secondary particles that form in the atmosphere itself [2]. The mix varies from place to place — traffic in one city, coal heating in another, agricultural fires in a third — but the levers for reducing it are broadly the same: cleaner fuels and electrification, tighter emission standards for vehicles and industry, a shift toward public and active transport, better waste and agricultural practice, and planning that keeps people away from the worst exposure. Because most of these emissions come from burning fossil fuels, cleaner air and a cooler climate are, for the most part, the same project [1].
The encouraging part is that this is not a counsel of despair. The historical record shows that air quality responds to policy — sometimes dramatically. Here is one story, told from four cities on four continents over the last three decades.
The oldest lesson. In December 1952, a cold, windless anticyclone settled over a city heated almost entirely by coal, and the resulting Great Smog killed at least four thousand people within days, with later analyses attributing as many as twelve thousand deaths in total [11]. The disaster produced the Clean Air Act of 1956, which created smoke-control areas and subsidised the switch to cleaner fuels; over the following decades coal gave way to gas and electricity, power stations moved out of the city, and visible particulate pollution collapsed [11]. London's modern problem is quieter and less visible — nitrogen dioxide and fine particles from road traffic — and its modern answer has been the Ultra Low Emission Zone, introduced in 2019 and extended across every borough in 2023, which charges the most polluting vehicles and has been associated with measurable falls in roadside nitrogen dioxide, though analysts stress it works only as one part of a wider transport strategy [12].
Proof it can be reversed. In January 2013 the city recorded an "airpocalypse" of readings that ran off the conventional scale, with an annual average fine-particle concentration of about 89 µg/m³ — nearly eighteen times the WHO guideline [9][10]. China's response was the 2013 Air Pollution Prevention and Control Action Plan, alongside Beijing's own five-year clean-air programme: coal-fired heating was converted to gas, heavy industry was relocated and consolidated, vehicle and construction-dust controls were tightened, and the surrounding Beijing–Tianjin–Hebei region coordinated its efforts [10]. By 2024 Beijing's annual average had fallen to roughly 30 µg/m³ — about a two-thirds reduction — while good-or-moderate air days rose from 176 to 290 and heavily polluted days dropped from 58 to just two [9]. The caveat matters: even after that progress, the city's air remains several times above the WHO guideline, and each further gain is harder won than the last [9].
Geography and agriculture. Every autumn, Greater Cairo experiences a "Black Cloud" — a season of heavy haze driven by the open burning of rice straw across the Nile Delta, compounded by waste burning, traffic, industry, desert dust and the temperature inversions that trap it all over the city [13][14]. A 2019 World Bank assessment estimated around 12,600 premature deaths a year in Greater Cairo from fine-particle exposure [13]. The measures now under way include a major World Bank-supported programme to modernise transport with electric buses, improve solid-waste management, expand the monitoring network and forecasting capability, and give farmers profitable alternatives to burning their straw [13].
The cautionary case. Tehran sits in a basin ringed by the Alborz mountains, and in winter the surrounding terrain and cold air produce persistent inversions that seal pollution over more than eight million residents [15]. Roughly four-fifths of that pollution comes from vehicles — an ageing fleet burning low-grade fuel — with heavy fuel oil in power plants adding to the load in the cold months [16]. The consequences recur almost every year: schools and universities closed, hospital admissions rising, and, in late 2025, Tehran ranking among the most polluted cities on Earth [16]. Iran passed its own Clean Air Act in 2017, calling for millions of old vehicles to be scrapped, but enforcement has been slow and the episodes continue [16].
Four very different cities, and one common thread: in every case, the turning point — or the failure to reach one — was tied to what could be measured and shown. London acted once a death toll had been counted; Beijing after concentrations were published and coordinated across a region; Cairo is building out monitoring and forecasting as part of its response; Tehran’s struggle is, in part, a struggle to convert measurement into enforcement. You cannot manage what you do not measure.
The node at SETU Carlow
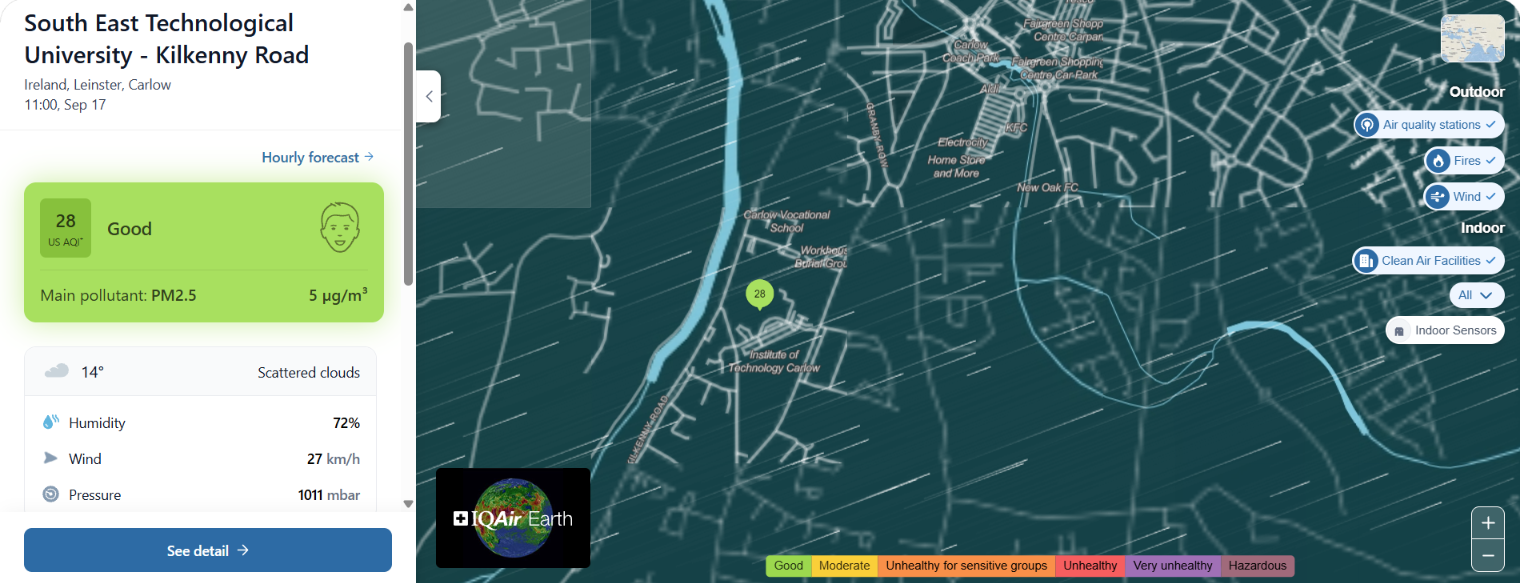
Which brings the story home. We have installed an outdoor air-quality monitoring node on the Kilkenny Road campus of South East Technological University in Carlow, and it now contributes to the global network operated by IQAir — a Swiss air-quality technology company, the air-quality monitoring partner of the UN Environment Programme, and the publisher of the widely cited annual World Air Quality Report [19][20]. The node reports fine-particle concentrations and the meteorological variables discussed above in real time, alongside a seven-day forecast.
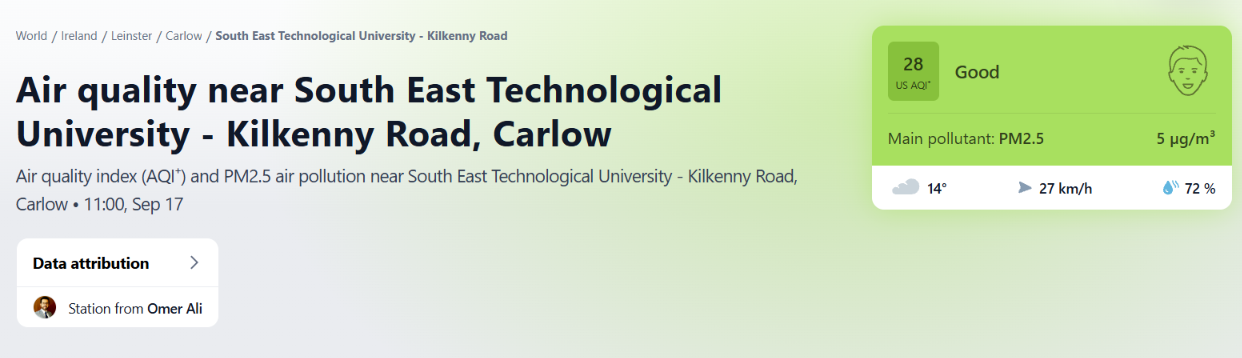
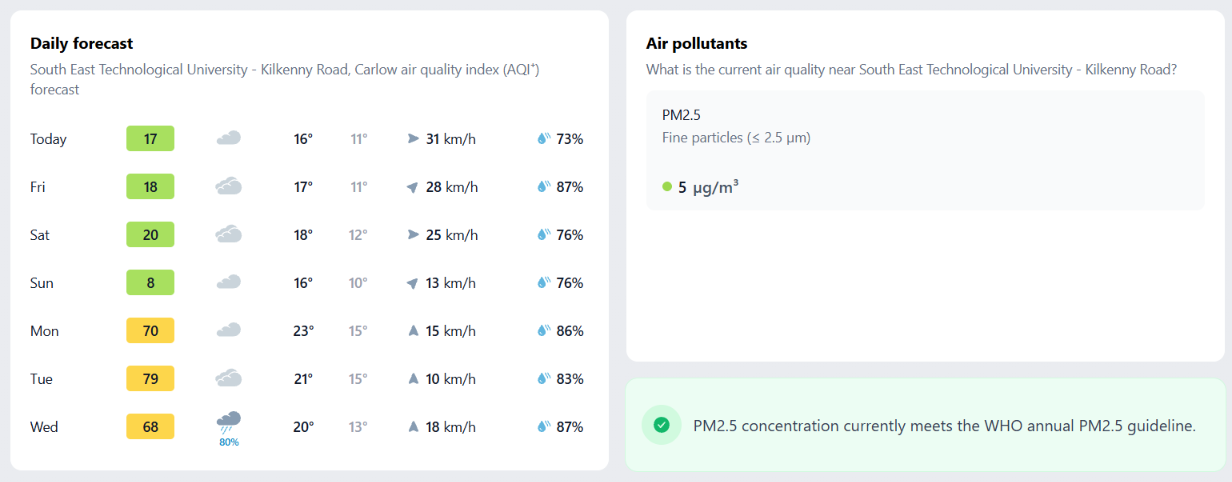
The current picture is good. At the time of writing (11:00 on 17 September), the station read a US AQI of 28 — comfortably within the “Good” band — with a PM2.5 concentration of 5 µg/m³, which meets the WHO annual guideline, under mild conditions of 14 °C, 72% humidity, a 27 km/h breeze and 1011 mbar of pressure. That places the air around the SETU Kilkenny road campus (Carlow) among the cleanest around the country.
I want to thank the people who made this first step possible: the Department of Computing and the Faculty of Science at SETU, and the University’s leadership, for recognising the significance of environmental monitoring and backing the initiative; and IQAir, for providing the monitoring node and the platform that carries its data.
One outdoor sensor is only part of the equation
A single outdoor node measures only a slice of our exposure. On average, people spend about 90% of their time indoors, and indoor concentrations of many pollutants are commonly two to five times — and occasionally far more — higher than outside, because homes and offices combine outdoor air that leaks in with indoor sources of their own: cooking, heating, cleaning products, furnishings and building materials [7].
The implication is direct. Good indoor air quality is tied to comfort, to health, and — in schools — to the concentration and performance of students and staff [8]. If we care about the air people actually breathe, we have to measure it where they breathe most of it: in homes, offices, classrooms, hospitals and care facilities, not only outdoors. Measurement has to move indoors as well as out.
The research ahead
That is the motivation for the research programme I am now beginning. The aim is to design cost-effective air-quality monitoring nodes, for both indoor and outdoor deployment, paired with a live dashboard that displays their readings. Nodes will be configurable as public or private according to need, and their precise locations can be obscured where privacy requires it — an important consideration once monitoring moves inside homes and workplaces. In outline, each node reports something like this:
NODE / TIMESTAMP / LAT-LON  (obfuscated when private)
— PM2.5, PM10                 particulate matter (µg/m³)
— Temperature, Humidity, Pressure
— Wind speed, Wind direction
— Noise  (dB, LAeq)           — Light  (lux)
— visibility: public | private
The dashboard is also a chance to widen what we count as part of “environmental quality.” Alongside the standard pollutants, the nodes will incorporate light and, in particular, noise sensors. Noise is the pollutant we most often overlook, yet the evidence is substantial: the WHO’s 2018 Environmental Noise Guidelines for the European Region recommend keeping road-traffic noise below 53 decibels on the day-evening-night measure, and the systematic reviews behind them link chronic noise exposure at school to poorer reading comprehension, memory and standardised test scores in children [17]. Work using The Irish Longitudinal Study on Ageing has examined similar associations with cognitive function in older adults in Irish cities [18]. Schools, colleges, universities, hospitals and care homes — precisely the institutions clustered in busy urban settings — are where both air and noise pollution do the most damage to concentration and wellbeing, and where measuring them together is most useful.
The purpose of gathering this data is to put it to work. Shared with city councils, government agencies, research institutes and individual scientists, it can feed models — including machine-learning models — that forecast air- and noise-pollution trends and inform decisions about traffic, congestion and noise management. The goal is not data for its own sake, but decision support: giving local authorities an evidence base for the trade-offs they already have to make.
Questions I am often asked
Is the air around the campus actually clean?
Isn't a single sensor too few to matter?
Why measure noise alongside air?
Will data from indoor nodes be private?
The air we breathe
Clean air is not something any one person, department or institution can secure alone. It is a shared inheritance, collective effort, and keeping it means watching over it together. The node on the Carlow campus is a small thing on its own — one sensor, one clean reading on one September morning. But it stands for a larger principle: we cannot protect what we have not measured, improve what we do not understand, or plan for what we cannot foresee. Understanding the air we breathe is the first, unglamorous and indispensable step toward preserving it — here, and in the many other places where this work can be replicated.
Written on my way to Carlow, after a busy bustling Times of Ireland Higher Options day in Dublin
References
- World Health Organization. Air pollution (health topic overview). https://www.who.int/health-topics/air-pollution
- World Health Organization. Ambient (outdoor) air pollution — fact sheet. https://www.who.int/news-room/fact-sheets/detail/ambient-(outdoor)-air-quality-and-health
- World Health Organization. Exposure and health impacts of air pollution. https://www.who.int/teams/environment-climate-change-and-health/air-quality-energy-and-health/health-impacts/exposure-air-pollution
- World Health Organization (2021). WHO global air quality guidelines: particulate matter (PM2.5 and PM10), ozone, nitrogen dioxide, sulfur dioxide and carbon monoxide. https://iris.who.int/handle/10665/345329
- US Environmental Protection Agency / AirNow. Air Quality Index (AQI) basics. https://www.airnow.gov/aqi/aqi-basics/
- A review of the chronological evolution of air quality indexing systems (1966 to 2021). Current World Environment (2021). https://www.cwejournal.org/vol16no3/a-review-of-chronological-evolution-of-air-quality-indexing-systems—1966-to-2021-
- US Environmental Protection Agency. The Inside Story: A Guide to Indoor Air Quality. https://www.epa.gov/indoor-air-quality-iaq/inside-story-guide-indoor-air-quality
- US Environmental Protection Agency. Why Indoor Air Quality is Important to Schools. https://www.epa.gov/iaq-schools/why-indoor-air-quality-important-schools
- Beijing Municipal Government (2024). Beijing achieves national air quality standards for the third consecutive year (2013–2023 pollutant reductions). https://english.beijing.gov.cn/specials/livablegreenbeijing/livablegreennews/202401/t20240104_3525383.html
- Dominant role of emission reduction in PM2.5 air quality improvement in Beijing during 2013–2017: a model-based decomposition analysis. Atmospheric Chemistry and Physics, 19, 6125–6146 (2019). https://acp.copernicus.org/articles/19/6125/2019/
- London Museum. The Great Smog of 1952. https://www.londonmuseum.org.uk/collections/london-stories/the-great-smog-of-1952/
- Greater London Authority. 70 years since the Great London Smog (and Ultra Low Emission Zone reporting). https://www.london.gov.uk/programmes-strategies/environment-and-climate-change/environment-and-climate-change-publications/70-years-great-london-smog
- World Bank (2026). Towards Better Air Quality in Egypt. https://blogs.worldbank.org/en/arabvoices/towards-better-air-quality-in-egypt
- Clean Air Fund. Cairo and air pollution. https://www.cleanairfund.org/clean-air-africas-cities/cairo/
- Air pollution trends in Tehran and their anthropogenic drivers. Atmospheric Pollution Research (2019). https://www.sciencedirect.com/science/article/abs/pii/S1309104219305033
- Thomson Reuters Foundation / Context (2025). Vanishing mountains: winter air pollution smothers Iran. https://www.context.news/climate-risks/vanishing-mountains-winter-air-pollution-smothers-iran
- Clark, C. & Paunović, K. (2018). WHO Environmental Noise Guidelines for the European Region: A Systematic Review on Environmental Noise and Cognition. International Journal of Environmental Research and Public Health, 15(2), 285. https://www.mdpi.com/1660-4601/15/2/285
- Road traffic noise and cognitive function in older adults: The Irish Longitudinal Study on Ageing (2021). https://www.ncbi.nlm.nih.gov/pmc/articles/PMC8501545/
- UN Environment Programme (2020). World’s largest platform for air quality data launched at the Tenth World Urban Forum. https://www.unep.org/news-and-stories/press-release/worlds-largest-platform-air-quality-data-launched-tenth-world-urban
- IQAir. Company overview, AirVisual platform and the World Air Quality Report. https://www.iqair.com